Summary: In 2026/27, council tax for a Band D property ranges from £1,028.21 in Wandsworth to £2,765.02 in Dorset. The table below compares every English council's 2026/27 rate with its 2025/26 rate and shows the year-on-year increase.
The average council tax in the UK varies enormously depending on where you live. In 2026/27, the gap between the cheapest and most expensive council tax in England is £1,736.81 per year for a Band D property - a difference of over 168%.
Figures below cover English local authorities only. Scottish and Welsh councils set their rates independently - check your local council's website for rates in Scotland and Wales.
How is council tax calculated?
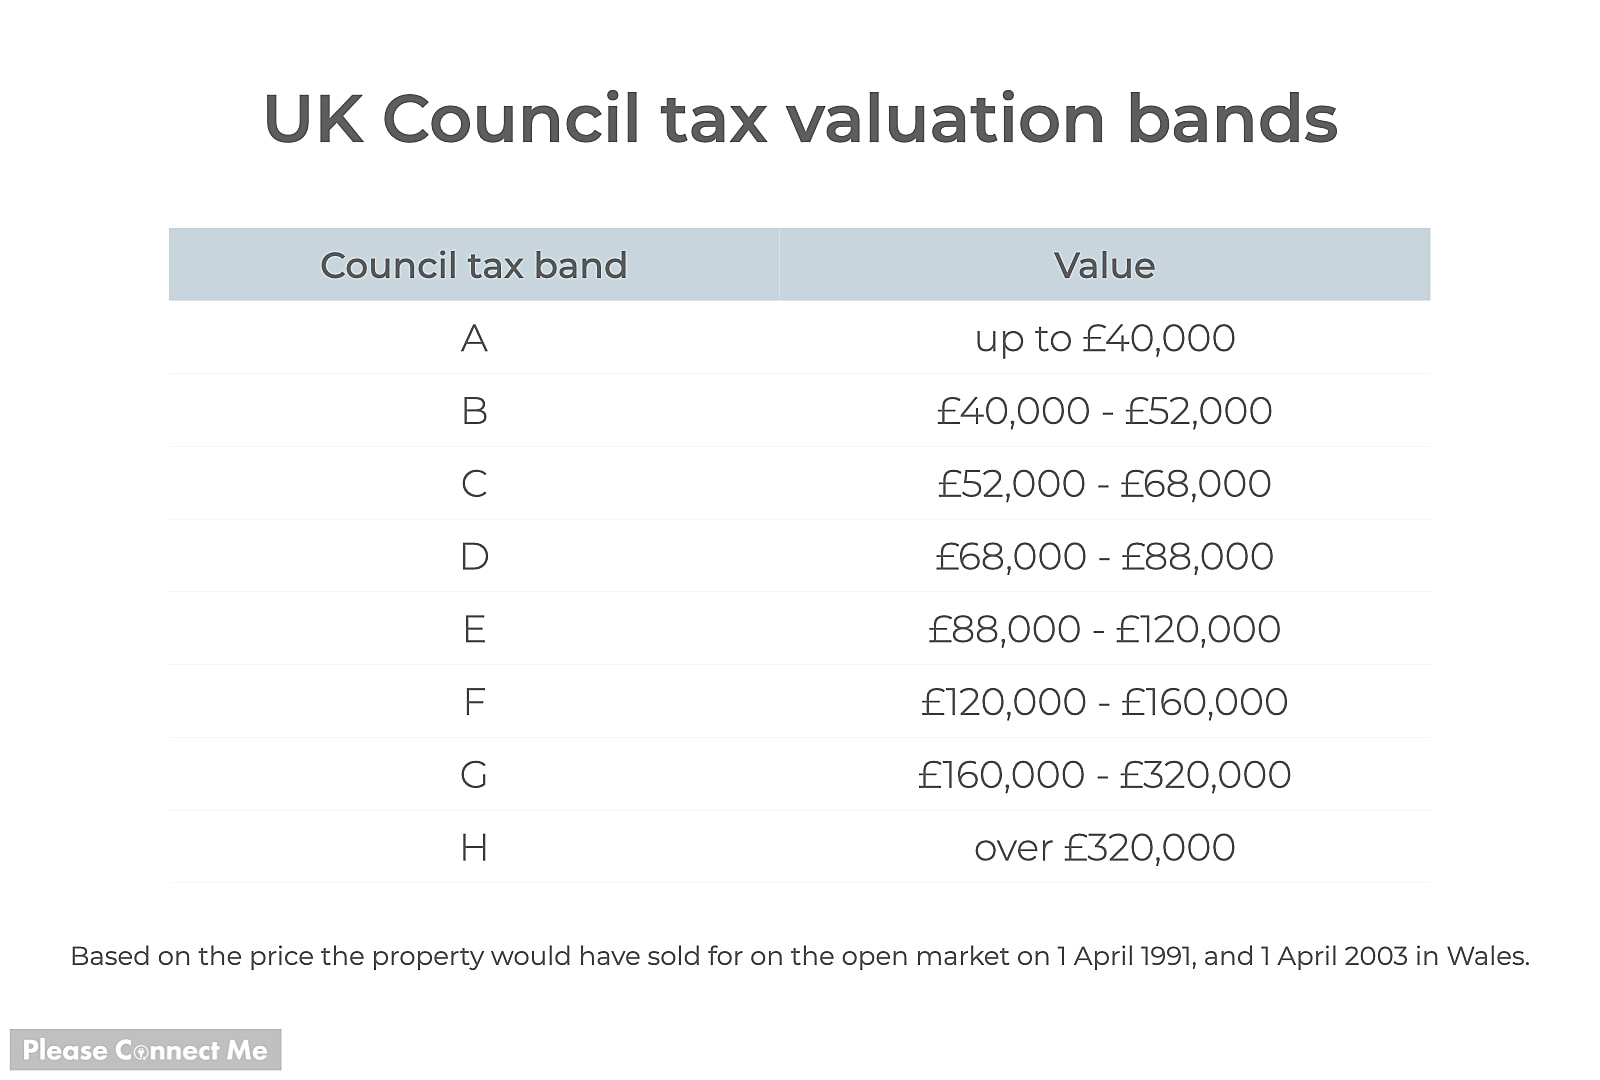
The amount you pay in council tax depends on two things: the value of your property and the local authority you live in. Every property in England is assigned a council tax band between A and H, based on what the property would have sold for in April 1991.
Each local authority then decides how much each band will pay as part of its annual budget. Properties in the same band can pay very different amounts depending on their location, which is why the average council tax in the UK varies so widely. Use our council tax checker to see your 2026/27 bill and how much it has increased.
Where is the UK's most expensive council tax in 2026/27?
In 2026/27, the most expensive council tax in England is in Dorset, where a Band D home pays £2,765.02 per year - up from £2,630.30 in 2025/26. Lewes (£2,756.17) and Nottingham (£2,755.39) are the second and third most expensive.
Where is the UK's cheapest council tax in 2026/27?
The cheapest council tax in England is in Wandsworth, London, where a Band D property pays £1,028.21 per year in 2026/27 - up from £997.75 in 2025/26. The second cheapest is also in London: Westminster, at £1,049.55 per year. Outside London, the cheapest area is Tower Hamlets at £1,837.78 per year. Key stat: A Band D household in Wandsworth pays £1,736.81 less per year than the equivalent household in Dorset - the largest council tax gap between any two English local authorities in 2026/27.
Average council tax in the UK by council 2026/27
The table below ranks every English local authority by annual Band D council tax for 2026/27, from cheapest to most expensive, alongside the 2025/26 figure and the year-on-year percentage increase.
Looking for your council? Search on this page, or use our Council tax checker
Very low tax (under £1,100 per year, Band D)
Very low council tax - annual Band D rate, England | ||||
Rank | Council | 2025/26 (Band D) | 2026/27 (Band D) | Year-on-year change |
|---|---|---|---|---|
1 | Wandsworth | £997.75 | £1,028.21 | +3.1% |
2 | Westminster | £1,019.00 | £1,049.55 | +3.0% |
Low tax (£1,100 to £1,999 per year, Band D)
Low council tax - annual Band D rate, England | ||||
Rank | Council | 2025/26 (Band D) | 2026/27 (Band D) | Year-on-year change |
|---|---|---|---|---|
3 | City of London | £1,274.07 | £1,329.56 | +4.4% |
4 | Hammersmith and Fulham | £1,451.42 | £1,519.51 | +4.7% |
5 | Kensington and Chelsea | £1,591.59 | £1,666.65 | +4.7% |
6 | Tower Hamlets | £1,754.57 | £1,837.78 | +4.7% |
7 | Newham | £1,855.96 | £1,944.23 | +4.8% |
8 | Windsor and Maidenhead | £1,823.50 | £1,952.62 | +7.1% |
9 | Southwark | £1,877.90 | £1,967.26 | +4.8% |
Average tax (£2,000 to £2,299 per year, Band D)
Average council tax - annual Band D rate, England | ||||
Rank | Council | 2025/26 (Band D) | 2026/27 (Band D) | Year-on-year change |
|---|---|---|---|---|
10 | Hillingdon | £1,952.38 | £2,045.46 | +4.8% |
11 | Lambeth | £1,953.95 | £2,047.11 | +4.8% |
12 | Isles of Scilly | £1,950.03 | £2,047.96 | +5.0% |
13 | Hackney | £1,966.51 | £2,060.30 | +4.8% |
14 | Greenwich | £2,011.81 | £2,107.86 | +4.8% |
15 | Islington | £2,012.10 | £2,108.15 | +4.8% |
16 | Barnet | £2,035.52 | £2,132.60 | +4.8% |
17 | Ealing | £2,041.02 | £2,138.53 | +4.8% |
18 | Bromley | £2,042.46 | £2,140.04 | +4.8% |
19 | Dudley | £2,038.57 | £2,144.84 | +5.2% |
20 | Merton | £2,094.43 | £2,146.76 | +2.5% |
21 | Wigan | £2,031.28 | £2,152.68 | +6.0% |
22 | Doncaster | £2,110.50 | £2,167.75 | +2.7% |
23 | Stoke-on-Trent | £2,078.34 | £2,183.12 | +5.0% |
24 | Hounslow | £2,085.82 | £2,185.56 | +4.8% |
25 | Sunderland | £2,092.79 | £2,197.14 | +5.0% |
26 | Solihull | £2,087.81 | £2,197.26 | +5.2% |
27 | Barking and Dagenham | £2,098.14 | £2,198.51 | +4.8% |
28 | Camden | £2,106.69 | £2,207.55 | +4.8% |
29 | Brent | £2,133.15 | £2,235.27 | +4.8% |
30 | Lewisham | £2,135.13 | £2,237.33 | +4.8% |
31 | Sandwell | £2,133.45 | £2,244.46 | +5.2% |
32 | Thurrock | £2,145.06 | £2,254.68 | +5.1% |
33 | Basingstoke and Deane | £2,147.87 | £2,255.21 | +5.0% |
34 | Telford and Wrekin | £2,146.19 | £2,256.26 | +5.1% |
35 | Brentwood | £2,166.72 | £2,258.14 | +4.2% |
36 | South Kesteven | £2,186.95 | £2,260.00 | +3.3% |
37 | Bracknell Forest | £2,155.21 | £2,264.80 | +5.1% |
38 | Southend-on-Sea | £2,154.65 | £2,265.17 | +5.1% |
39 | Enfield | £2,164.02 | £2,267.67 | +4.8% |
40 | Tendring | £2,178.46 | £2,269.63 | +4.2% |
41 | Fareham | £2,164.55 | £2,270.55 | +4.9% |
42 | East Lindsey | £2,201.57 | £2,275.88 | +3.4% |
43 | Epping Forest | £2,186.69 | £2,277.21 | +4.1% |
44 | South Holland | £2,205.31 | £2,278.20 | +3.3% |
45 | Braintree | £2,194.67 | £2,280.34 | +3.9% |
46 | Colchester | £2,192.08 | £2,282.85 | +4.1% |
47 | Leeds | £2,172.39 | £2,283.73 | +5.1% |
48 | York | £2,175.05 | £2,287.15 | +5.2% |
49 | Trafford | £2,122.54 | £2,291.70 | +8.0% |
50 | Portsmouth | £2,180.92 | £2,291.71 | +5.1% |
51 | Peterborough | £2,185.72 | £2,293.47 | +4.9% |
52 | Redbridge | £2,189.67 | £2,294.58 | +4.8% |
53 | Kingston upon Hull | £2,182.52 | £2,295.04 | +5.2% |
54 | Wakefield | £2,185.93 | £2,296.89 | +5.1% |
55 | Harlow | £2,216.43 | £2,298.69 | +3.7% |
High tax (£2,300 to £2,499 per year, Band D)
High council tax - annual Band D rate, England | ||||
Rank | Council | 2025/26 (Band D) | 2026/27 (Band D) | Year-on-year change |
|---|---|---|---|---|
56 | Chelmsford | £2,206.97 | £2,300.18 | +4.2% |
57 | Tamworth | £2,209.81 | £2,300.76 | +4.1% |
58 | Stafford | £2,210.78 | £2,302.68 | +4.2% |
59 | Test Valley | £2,196.53 | £2,305.52 | +5.0% |
60 | Derby | £2,195.75 | £2,306.00 | +5.0% |
61 | Broxbourne | £2,198.11 | £2,306.43 | +4.9% |
62 | Boston | £2,236.62 | £2,308.73 | +3.2% |
63 | Manchester | £2,183.03 | £2,312.04 | +5.9% |
64 | South Staffordshire | £2,219.66 | £2,313.67 | +4.2% |
65 | Haringey | £2,207.94 | £2,313.78 | +4.8% |
66 | Mid Suffolk | £2,208.43 | £2,316.88 | +4.9% |
67 | Castle Point | £2,227.21 | £2,318.63 | +4.1% |
68 | Havant | £2,212.89 | £2,320.28 | +4.9% |
69 | Rushmoor | £2,212.82 | £2,320.28 | +4.9% |
70 | Lincoln | £2,260.98 | £2,323.08 | +2.7% |
71 | Barnsley | £2,241.35 | £2,325.96 | +3.8% |
72 | Basildon | £2,244.63 | £2,327.24 | +3.7% |
73 | Maldon | £2,232.83 | £2,328.37 | +4.3% |
74 | Medway | £2,207.33 | £2,328.55 | +5.5% |
75 | Uttlesford | £2,237.45 | £2,333.82 | +4.3% |
76 | Newcastle-under-Lyme | £2,244.85 | £2,334.25 | +4.0% |
77 | East Suffolk | £2,222.36 | £2,334.80 | +5.1% |
78 | North Kesteven | £2,261.06 | £2,337.81 | +3.4% |
79 | Staffordshire Moorlands | £2,240.43 | £2,338.21 | +4.4% |
80 | Chesterfield | £2,233.12 | £2,339.49 | +4.8% |
81 | South Derbyshire | £2,231.86 | £2,339.61 | +4.8% |
82 | Tewkesbury | £2,226.55 | £2,340.53 | +5.1% |
83 | Babergh | £2,233.16 | £2,341.55 | +4.9% |
84 | Eastleigh | £2,227.68 | £2,342.21 | +5.1% |
85 | East Hampshire | £2,231.64 | £2,343.92 | +5.0% |
86 | Gosport | £2,236.14 | £2,344.29 | +4.8% |
87 | North Lincolnshire | £2,238.09 | £2,348.46 | +4.9% |
88 | East Staffordshire | £2,257.48 | £2,351.34 | +4.2% |
89 | West Suffolk | £2,243.00 | £2,351.47 | +4.8% |
90 | Lichfield | £2,259.21 | £2,351.90 | +4.1% |
91 | West Lindsey | £2,279.77 | £2,354.25 | +3.3% |
92 | Gloucester | £2,246.16 | £2,355.84 | +4.9% |
93 | Winchester | £2,251.22 | £2,359.76 | +4.8% |
94 | Erewash | £2,260.06 | £2,360.64 | +4.5% |
95 | Bradford | £2,246.15 | £2,360.73 | +5.1% |
96 | Birmingham | £2,245.41 | £2,362.90 | +5.2% |
97 | Rochford | £2,268.00 | £2,363.48 | +4.2% |
98 | Bexley | £2,258.03 | £2,366.36 | +4.8% |
99 | Halton | £2,249.34 | £2,366.61 | +5.2% |
100 | Cheltenham | £2,258.28 | £2,369.52 | +4.9% |
101 | Milton Keynes | £2,257.98 | £2,372.21 | +5.1% |
102 | Wychavon | £2,200.98 | £2,373.19 | +7.8% |
103 | Dartford | £2,280.55 | £2,375.15 | +4.1% |
104 | Cannock Chase | £2,282.30 | £2,375.83 | +4.1% |
105 | Sutton | £2,269.72 | £2,378.64 | +4.8% |
106 | Southampton | £2,266.44 | £2,381.48 | +5.1% |
107 | Rotherham | £2,283.26 | £2,381.53 | +4.3% |
108 | Hinckley and Bosworth | £2,304.14 | £2,382.62 | +3.4% |
109 | Bath and North East Somerset | £2,265.80 | £2,383.42 | +5.2% |
110 | High Peak | £2,275.52 | £2,384.66 | +4.8% |
111 | Ribble Valley | £2,299.58 | £2,386.50 | +3.8% |
112 | Waltham Forest | £2,277.65 | £2,386.96 | +4.8% |
113 | Harborough | £2,324.96 | £2,389.87 | +2.8% |
114 | Cotswold | £2,276.70 | £2,391.65 | +5.0% |
115 | Stevenage | £2,281.28 | £2,391.97 | +4.9% |
116 | Bolton | £2,266.53 | £2,399.74 | +5.9% |
117 | Hart | £2,285.15 | £2,400.02 | +5.0% |
118 | St Helens | £2,288.53 | £2,403.38 | +5.0% |
119 | Charnwood | £2,327.50 | £2,405.64 | +3.4% |
120 | Swale | £2,305.72 | £2,405.65 | +4.3% |
121 | Worcester | £2,233.93 | £2,405.81 | +7.7% |
122 | Hertsmere | £2,289.22 | £2,405.83 | +5.1% |
123 | Oadby and Wigston | £2,330.02 | £2,406.85 | +3.3% |
124 | Amber Valley | £2,297.98 | £2,407.69 | +4.8% |
125 | Gravesham | £2,313.06 | £2,408.24 | +4.1% |
126 | Dacorum | £2,294.23 | £2,408.51 | +5.0% |
127 | Ashford | £2,311.19 | £2,410.16 | +4.3% |
128 | Great Yarmouth | £2,305.13 | £2,414.41 | +4.7% |
129 | Slough | £2,298.55 | £2,414.44 | +5.0% |
130 | North West Leicestershire | £2,338.10 | £2,418.20 | +3.4% |
131 | Crawley | £2,306.49 | £2,418.46 | +4.9% |
132 | St Albans | £2,305.95 | £2,419.22 | +4.9% |
133 | Canterbury | £2,321.73 | £2,419.33 | +4.2% |
134 | New Forest | £2,303.37 | £2,419.76 | +5.1% |
135 | Calderdale | £2,302.33 | £2,420.15 | +5.1% |
136 | Three Rivers | £2,306.47 | £2,422.31 | +5.0% |
137 | North Northamptonshire | £2,301.93 | £2,423.96 | +5.3% |
138 | Havering | £2,313.55 | £2,424.66 | +4.8% |
139 | Melton | £2,350.68 | £2,429.67 | +3.4% |
140 | King's Lynn and West Norfolk | £2,318.63 | £2,430.13 | +4.8% |
141 | Chorley | £2,342.85 | £2,430.23 | +3.7% |
142 | South Tyneside | £2,311.18 | £2,434.43 | +5.3% |
143 | Bournemouth, Christchurch and Poole | £2,264.78 | £2,435.58 | +7.5% |
144 | Broadland | £2,327.99 | £2,437.78 | +4.7% |
145 | Swindon | £2,317.63 | £2,438.10 | +5.2% |
146 | Luton | £2,320.43 | £2,439.93 | +5.1% |
147 | Horsham | £2,321.54 | £2,441.01 | +5.1% |
148 | Kirklees | £2,321.76 | £2,441.07 | +5.1% |
149 | Plymouth | £2,325.42 | £2,441.85 | +5.0% |
150 | South Ribble | £2,352.12 | £2,442.66 | +3.8% |
151 | Forest of Dean | £2,326.88 | £2,443.42 | +5.0% |
152 | Breckland | £2,328.59 | £2,443.67 | +4.9% |
153 | Derbyshire Dales | £2,332.42 | £2,444.70 | +4.8% |
154 | Tunbridge Wells | £2,347.20 | £2,446.15 | +4.2% |
155 | Watford | £2,343.38 | £2,446.70 | +4.4% |
156 | Tameside | £2,311.80 | £2,447.21 | +5.9% |
157 | Warrington | £2,281.40 | £2,447.61 | +7.3% |
158 | North Hertfordshire | £2,332.61 | £2,448.52 | +5.0% |
159 | Malvern Hills | £2,280.82 | £2,450.92 | +7.5% |
160 | Welwyn Hatfield | £2,333.46 | £2,452.26 | +5.1% |
161 | East Hertfordshire | £2,339.63 | £2,454.78 | +4.9% |
162 | Cheshire East | £2,332.61 | £2,454.87 | +5.2% |
163 | Blackburn with Darwen | £2,337.17 | £2,455.27 | +5.1% |
164 | Worthing | £2,343.12 | £2,456.13 | +4.8% |
165 | West Lancashire | £2,362.12 | £2,456.23 | +4.0% |
166 | North Norfolk | £2,341.13 | £2,459.93 | +5.1% |
167 | Wyre | £2,365.73 | £2,460.53 | +4.0% |
168 | Warwick | £2,356.53 | £2,461.55 | +4.5% |
169 | Dover | £2,364.45 | £2,461.74 | +4.1% |
170 | North Tyneside | £2,336.45 | £2,461.77 | +5.4% |
171 | Redditch | £2,289.33 | £2,462.95 | +7.6% |
172 | Hyndburn | £2,380.02 | £2,465.98 | +3.6% |
173 | East Riding of Yorkshire | £2,343.55 | £2,466.08 | +5.2% |
174 | North East Derbyshire | £2,354.93 | £2,466.57 | +4.7% |
175 | Cambridge | £2,355.41 | £2,467.02 | +4.7% |
176 | Ipswich | £2,358.54 | £2,468.25 | +4.7% |
177 | Chichester | £2,346.40 | £2,469.68 | +5.3% |
178 | Torbay | £2,350.64 | £2,470.25 | +5.1% |
179 | Bedford | £2,350.94 | £2,471.74 | +5.1% |
180 | Tonbridge and Malling | £2,374.77 | £2,471.83 | +4.1% |
181 | Mid Sussex | £2,356.49 | £2,474.26 | +5.0% |
182 | Bromsgrove | £2,302.72 | £2,478.65 | +7.6% |
183 | South Norfolk | £2,367.89 | £2,482.87 | +4.9% |
184 | Rugby | £2,378.04 | £2,483.05 | +4.4% |
185 | North East Lincolnshire | £2,371.01 | £2,483.85 | +4.8% |
186 | Fylde | £2,387.78 | £2,483.94 | +4.0% |
187 | Stratford-on-Avon | £2,379.91 | £2,484.17 | +4.4% |
188 | East Cambridgeshire | £2,374.13 | £2,485.18 | +4.7% |
189 | Richmond upon Thames | £2,372.07 | £2,486.10 | +4.8% |
190 | West Northamptonshire | £2,362.51 | £2,486.66 | +5.3% |
191 | Arun | £2,371.09 | £2,487.24 | +4.9% |
192 | Knowsley | £2,371.28 | £2,488.25 | +4.9% |
193 | Blaby | £2,406.77 | £2,490.22 | +3.5% |
194 | Thanet | £2,391.23 | £2,490.90 | +4.2% |
195 | North Somerset | £2,294.94 | £2,491.22 | +8.6% |
196 | Stroud | £2,369.37 | £2,491.36 | +5.1% |
197 | Runnymede | £2,380.06 | £2,492.99 | +4.7% |
198 | Darlington | £2,371.60 | £2,493.83 | +5.2% |
199 | Exeter | £2,379.90 | £2,495.36 | +4.9% |
200 | Wokingham | £2,376.11 | £2,497.70 | +5.1% |
Very high tax (£2,500 and over per year, Band D)
Very high council tax - annual Band D rate, England | ||||
Rank | Council | 2025/26 (Band D) | 2026/27 (Band D) | Year-on-year change |
|---|---|---|---|---|
201 | Wirral | £2,381.66 | £2,500.59 | +5.0% |
202 | Nuneaton and Bedworth | £2,398.13 | £2,502.16 | +4.3% |
203 | Maidstone | £2,403.78 | £2,502.59 | +4.1% |
204 | Lancaster | £2,407.50 | £2,503.19 | +4.0% |
205 | Norwich | £2,391.59 | £2,503.44 | +4.7% |
206 | West Berkshire | £2,382.84 | £2,505.37 | +5.1% |
207 | Westmorland and Furness | £2,389.00 | £2,507.99 | +5.0% |
208 | Sheffield | £2,388.76 | £2,510.16 | +5.1% |
209 | Harrow | £2,395.86 | £2,511.07 | +4.8% |
210 | Cumberland | £2,393.90 | £2,511.32 | +4.9% |
211 | Wyre Forest | £2,327.49 | £2,512.47 | +7.9% |
212 | Blackpool | £2,392.21 | £2,513.22 | +5.1% |
213 | Central Bedfordshire | £2,394.14 | £2,516.16 | +5.1% |
214 | Coventry | £2,413.68 | £2,516.72 | +4.3% |
215 | Cheshire West and Chester | £2,392.03 | £2,517.33 | +5.2% |
216 | Mole Valley | £2,405.75 | £2,519.86 | +4.7% |
217 | Rossendale | £2,424.37 | £2,519.97 | +3.9% |
218 | Sevenoaks | £2,419.44 | £2,522.36 | +4.3% |
219 | Spelthorne | £2,412.78 | £2,526.44 | +4.7% |
220 | Buckinghamshire | £2,401.53 | £2,526.58 | +5.2% |
221 | Shropshire | £2,318.80 | £2,528.18 | +9.0% |
222 | Leicester | £2,407.72 | £2,528.75 | +5.0% |
223 | Epsom and Ewell | £2,416.84 | £2,530.84 | +4.7% |
224 | North Warwickshire | £2,431.78 | £2,532.10 | +4.1% |
225 | South Cambridgeshire | £2,414.52 | £2,536.25 | +5.0% |
226 | Fenland | £2,432.81 | £2,537.74 | +4.3% |
227 | Folkestone and Hythe | £2,437.35 | £2,538.75 | +4.2% |
228 | Wolverhampton | £2,413.98 | £2,538.99 | +5.2% |
229 | Newcastle upon Tyne | £2,413.15 | £2,542.19 | +5.3% |
230 | North Yorkshire | £2,418.26 | £2,544.34 | +5.2% |
231 | Redcar and Cleveland | £2,424.47 | £2,544.48 | +4.9% |
232 | Guildford | £2,428.89 | £2,547.30 | +4.9% |
233 | Adur | £2,432.50 | £2,548.28 | +4.8% |
234 | Middlesbrough | £2,487.65 | £2,549.16 | +2.5% |
235 | Burnley | £2,455.83 | £2,549.42 | +3.8% |
236 | South Gloucestershire | £2,427.90 | £2,550.59 | +5.1% |
237 | Bury | £2,414.58 | £2,555.15 | +5.8% |
238 | Huntingdonshire | £2,439.67 | £2,556.40 | +4.8% |
239 | Elmbridge | £2,442.92 | £2,557.75 | +4.7% |
240 | Bolsover | £2,447.51 | £2,559.41 | +4.6% |
241 | Hartlepool | £2,498.53 | £2,560.20 | +2.5% |
242 | Somerset | £2,438.62 | £2,560.59 | +5.0% |
243 | Reigate and Banstead | £2,459.20 | £2,566.61 | +4.4% |
244 | West Oxfordshire | £2,443.88 | £2,566.95 | +5.0% |
245 | Wiltshire | £2,443.40 | £2,571.78 | +5.3% |
246 | Herefordshire | £2,449.17 | £2,574.37 | +5.1% |
247 | Preston | £2,477.85 | £2,575.74 | +4.0% |
248 | Vale of White Horse | £2,456.82 | £2,577.44 | +4.9% |
249 | Brighton and Hove | £2,456.78 | £2,580.54 | +5.0% |
250 | Cherwell | £2,463.87 | £2,582.96 | +4.8% |
251 | Sefton | £2,460.92 | £2,583.22 | +5.0% |
252 | Surrey Heath | £2,467.86 | £2,585.16 | +4.8% |
253 | Stockton-on-Tees | £2,468.74 | £2,589.83 | +4.9% |
254 | Cornwall | £2,459.92 | £2,590.93 | +5.3% |
255 | Salford | £2,452.02 | £2,594.45 | +5.8% |
256 | Tandridge | £2,471.62 | £2,594.85 | +5.0% |
257 | East Devon | £2,461.40 | £2,595.46 | +5.4% |
258 | Northumberland | £2,464.63 | £2,596.94 | +5.4% |
259 | South Oxfordshire | £2,474.44 | £2,597.57 | +5.0% |
260 | Woking | £2,482.03 | £2,598.04 | +4.7% |
261 | Croydon | £2,480.48 | £2,599.91 | +4.8% |
262 | Mansfield | £2,498.40 | £2,600.38 | +4.1% |
263 | Rochdale | £2,458.09 | £2,600.83 | +5.8% |
264 | Torridge | £2,479.12 | £2,601.42 | +4.9% |
265 | Oldham | £2,459.40 | £2,602.23 | +5.8% |
266 | Waverley | £2,483.85 | £2,604.87 | +4.9% |
267 | Ashfield | £2,506.63 | £2,608.76 | +4.1% |
268 | Kingston upon Thames | £2,489.34 | £2,609.20 | +4.8% |
269 | Gedling | £2,507.09 | £2,609.55 | +4.1% |
270 | Reading | £2,487.11 | £2,612.77 | +5.1% |
271 | South Hams | £2,491.75 | £2,615.22 | +5.0% |
272 | Broxtowe | £2,516.20 | £2,618.21 | +4.1% |
273 | Stockport | £2,475.31 | £2,618.90 | +5.8% |
274 | Durham | £2,551.17 | £2,622.15 | +2.8% |
275 | Isle of Wight | £2,493.36 | £2,625.79 | +5.3% |
276 | Walsall | £2,498.27 | £2,627.48 | +5.2% |
277 | Pendle | £2,535.19 | £2,640.18 | +4.1% |
278 | North Devon | £2,514.66 | £2,642.21 | +5.1% |
279 | Teignbridge | £2,512.83 | £2,643.12 | +5.2% |
280 | Rushcliffe | £2,531.50 | £2,643.27 | +4.4% |
281 | Bassetlaw | £2,539.53 | £2,644.95 | +4.2% |
282 | Eastbourne | £2,532.49 | £2,654.28 | +4.8% |
283 | Mid Devon | £2,521.17 | £2,656.41 | +5.4% |
284 | Liverpool | £2,546.45 | £2,673.59 | +5.0% |
285 | Hastings | £2,554.14 | £2,676.58 | +4.8% |
286 | Oxford | £2,557.13 | £2,678.40 | +4.7% |
287 | Newark and Sherwood | £2,582.22 | £2,682.10 | +3.9% |
288 | Rother | £2,561.29 | £2,700.95 | +5.5% |
289 | West Devon | £2,574.29 | £2,705.33 | +5.1% |
290 | Bristol | £2,583.89 | £2,713.68 | +5.0% |
291 | Gateshead | £2,578.46 | £2,715.81 | +5.3% |
292 | Wealden | £2,608.44 | £2,728.43 | +4.6% |
293 | Rutland | £2,671.01 | £2,737.58 | +2.5% |
294 | Nottingham | £2,656.19 | £2,755.39 | +3.7% |
295 | Lewes | £2,627.39 | £2,756.17 | +4.9% |
296 | Dorset | £2,630.30 | £2,765.02 | +5.1% |
Sources: Cambridge News - council tax rates 2026/27; Department for Levelling Up, Housing and Communities - council tax statistics. Figures show the average Band D council tax, including county, district and any other authority charges. Scottish and Welsh councils are not included as they set rates independently.
Frequently asked questions about council tax in the UK
What is the average council tax in the UK in 2026/27?
Council tax for a Band D property ranges from £1,028.21 per year in Wandsworth to £2,765.02 per year in Dorset in 2026/27. Bills vary by local authority - every English council sets its own rate each February for the following April.
Which area has the cheapest council tax in England in 2026/27?
Wandsworth in London has the cheapest council tax in England, with Band D properties paying £1,028.21 per year in 2026/27 - up from £997.75 in 2025/26. Westminster is the second cheapest at £1,049.55 per year. Outside London, Tower Hamlets is the cheapest area at £1,837.78 per year.
Which area has the most expensive council tax in England in 2026/27?
Dorset has the highest Band D council tax in England at £2,765.02 per year in 2026/27. Lewes (£2,756.17) and Nottingham (£2,755.39) are also among the most expensive.
How is council tax calculated?
Council tax is based on two factors: the band your property falls into (A to H, based on its estimated value in April 1991) and the rate set by your local council each February. Your Band D rate is the baseline, and all other bands are calculated as fixed fractions of it. Band A pays 6/9 of the Band D rate; Band H pays double.
Can I reduce my council tax bill?
Yes. If you are the only adult in your home, you qualify for a 25% single-person discount. Full-time students are exempt. If you are on a low income, apply to your local council for a council tax reduction. You can also challenge your band if comparable properties nearby are in a lower band - a successful challenge is backdated, which can mean a refund.
Why does council tax vary so much across the UK?
Each local authority sets its own rate based on its spending needs and the level of central government funding it receives. Councils with lower central funding or higher service delivery costs tend to charge more. London boroughs such as Wandsworth and Westminster receive more government support and have historically set lower rates.
When does council tax go up?
Council tax rates change on 1 April each year. In England, most councils can raise council tax by up to 5% per year (3% core increase plus a 2% adult social care precept) without holding a local referendum. Councils wishing to raise by more than 5% must hold a public vote. Some financially distressed councils have been granted special permission to exceed this cap.